How is Inflation Impacting the Cost of Living in the U.S.? 2023 Key Statistics

As 67% of Americans express great concern about increases in the cost of living, it is important to have a better understanding of the cost of living index in your state or any state to which you may be planning to relocate.
The cost of living index can help you assess whether your income is sufficient to pay for your essential living expenses. From there, you can determine if enough additional money is left to pay off debt or save for retirement.
The following statistics gathered by Credit Summit will give you a better view of essential data regarding the cost of living in the United States.
Key Takeaways
What is the Cost of Living?
The cost of living is the total required to pay for necessities, including clothing, housing, transportation, and health care. These living costs can differ significantly between states. Cost of living indexes help to clarify these differences.
To generate these indexes, a baseline for comparison must first be established. The baseline used to compare expenses between states is the national average cost of living, set at 100. Then, states are evaluated in comparison to this standard. For instance, states with a cost of living index of 200 are twice as expensive as the rest of the country. States with an index of 50 will be cheaper to live in than the rest of the country.
Employers use cost of living indexes to determine wages, while governmental organizations use them to assess the need for measures such as yearly adjustments to Social Security benefits. These measures are also used by people considering relocation, particularly for employment reasons.
The Cost of Living in the United States
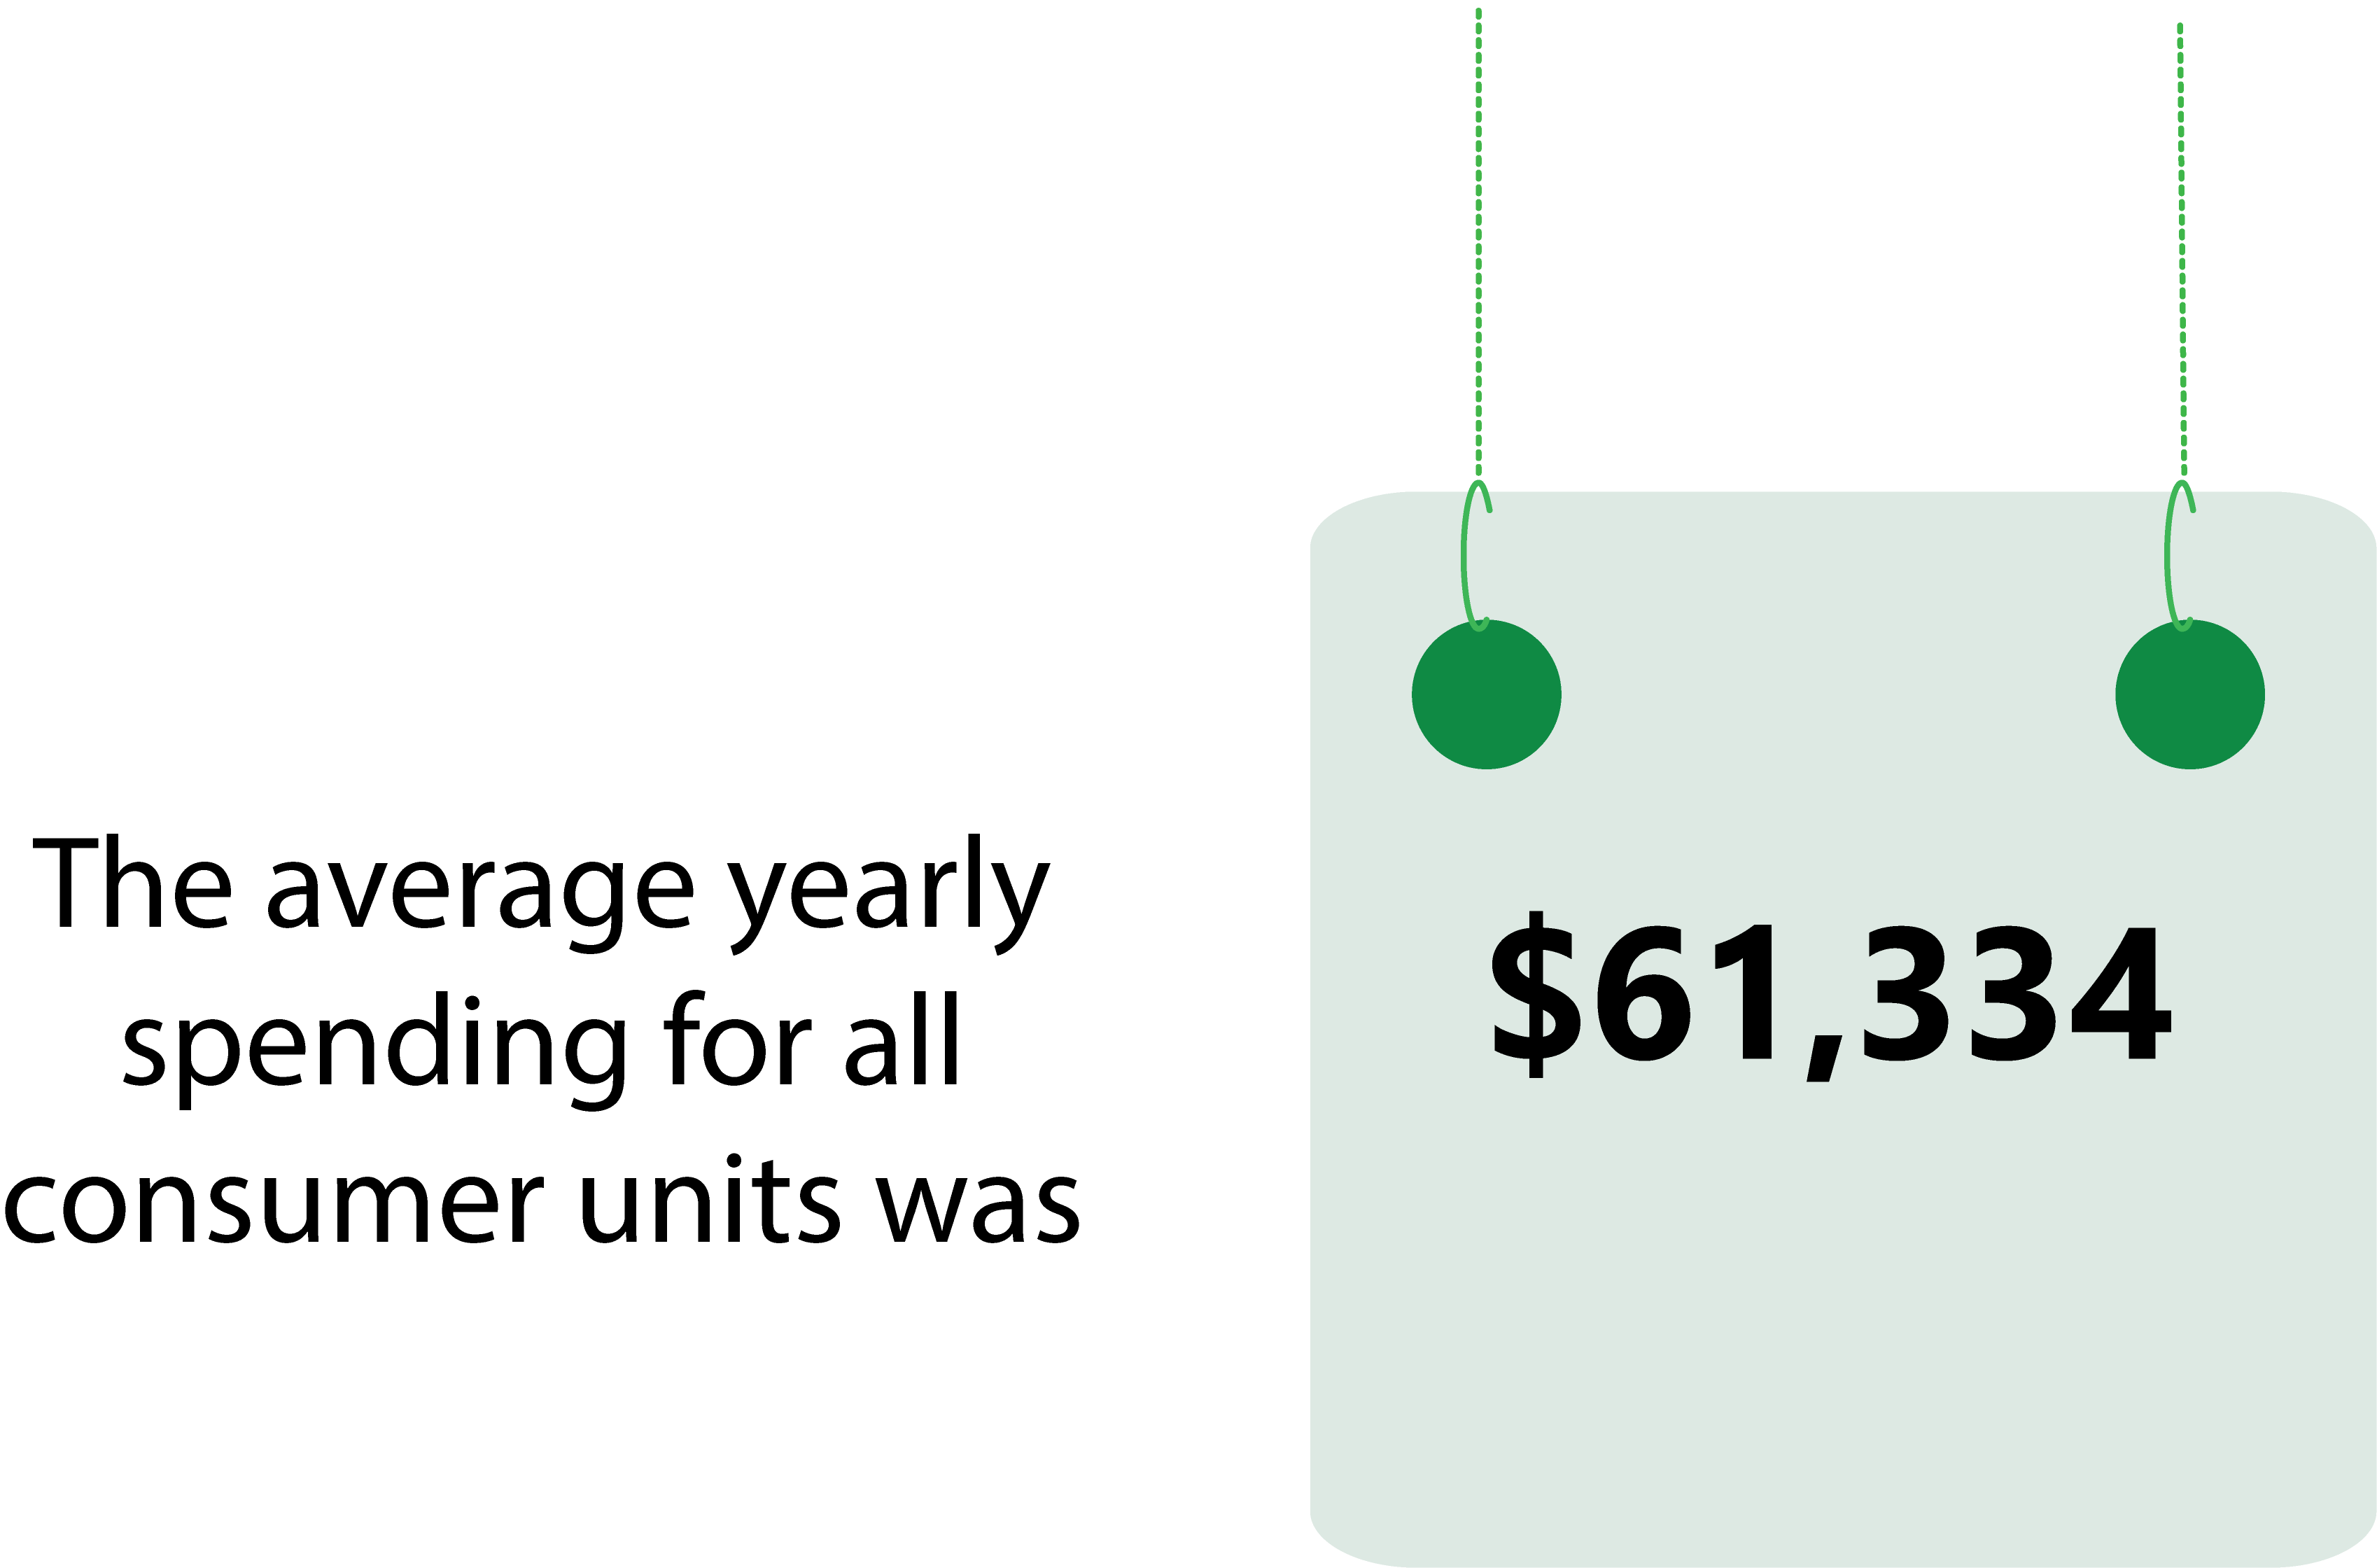
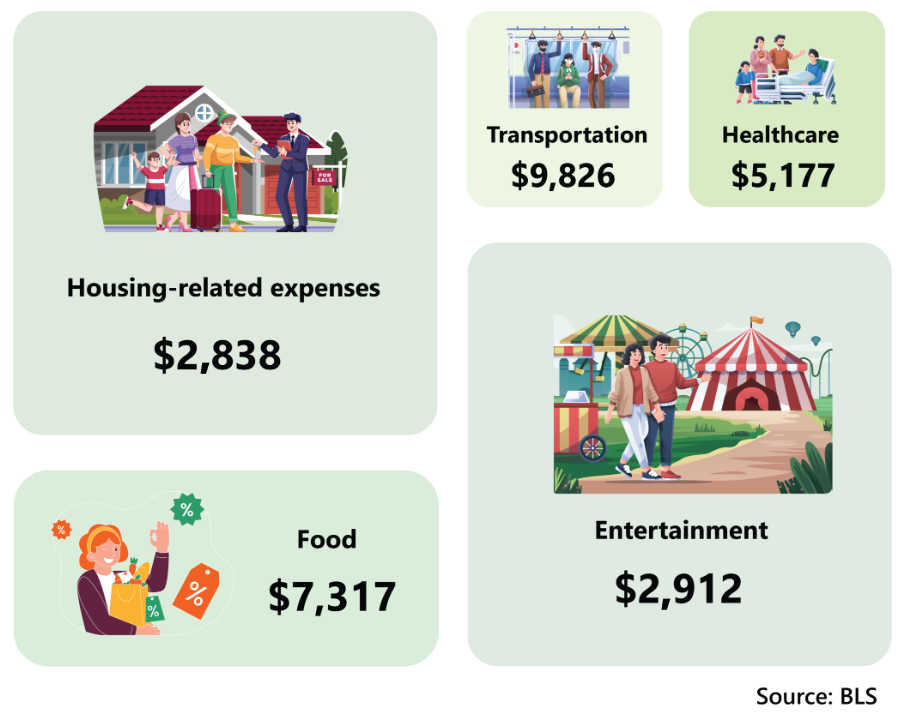
To understand the cost of living variations in different states, it is necessary to better understand the national cost of living. In 2020, the average annual spending for all consumer units (families, singles living alone, or people living together and sharing major expenses) was $61,334.


Inflation's Impact on the Cost of Living
Inflation appeared to be an afterthought two years ago, when millions of people were unemployed and central bankers and politicians were working on getting the U.S. economy out of a pandemic-induced recession.
Many of the same authorities argued that the price increases were "transitory" and resulted from clogged supply chains, labor shortages, and other problems that would resolve themselves sooner rather than later a year later, with unemployment declining and the inflation rate rising.
Inflation in the United States was the 13th highest among the 44 nations analyzed in the first quarter of this year, averaging 8.6%. Moreover, in the United States, the first-quarter inflation rate was nearly four times higher than the same period in 2020.

Which products are experiencing the highest increase?
Food
After increasing by 0.9% the month before, the food index jumped by 1.2% in May 2022. Moreover, the index for home food increased by 1.4% in May, marking the sixth month in a row with an at least 1.0% increase.
The home food index experienced its most significant 12-month growth since April 1979, an increase of 11.9% over the previous year. Additionally, the meats, poultry, and fish index saw a large increase (14.2%), with the index for eggs having the most significant increase (32.2%). Increases in the remaining categories ranged from 8.2% (fruits and vegetables) to 12.6% (other food at home).
Over the previous year, the index for eating out increased by 7.4%. Over the previous 12 months, the index for full-service meals increased by 9.0%, while the index for limited-service meals increased by 7.3%.

Energy
In the previous 12 months, the energy index increased by 34.6%. Over the same period, the fuel index rose by 48.7%. The fuel oil index, on the other hand, increased by 106.7% — more than doubling — marking the highest increase since 1935.
The electricity index increased by 12.0% (the most during a 12-month period since August 2006). Finally, the most significant rise since July 2008 was seen in the natural gas index, which rose by 30.2% during the last year.

All items excluding food and energy
In May 2022, the index for all items excluding food and energy increased by 6.0%, with the shelter index experiencing its most significant 12-month increase since the year ending in February 1991, rising 5.5% over the previous year.
Over the previous 12 months, the index for home operations and furnishings climbed by 8.9%. Moreover, the index for new and used cars and trucks jumped by 12.6% and 16.1%, respectively, while the index for airfare increased by 37.8%.

Cost of Living Comparison by State: Lowest Cost of Living Index
Mississippi, with an index of 83.1, has the lowest cost of living in the United States. As a result, the expenses in this state are 17% lower than the national average. Following in second place with an index of 84.8 is Oklahoma. Other states with a low cost of living index are listed below.
Cost of Living Comparison by State: Highest Cost of Living Index
The most expensive U.S. state to live in is Hawaii. Hawaii's cost of living is nearly twice as high as the national average, with a cost of living index of 192.7. With a cost of living index of 158.8, the District of Columbia is the second-most costly state in the US. Below are the top 10 states with the highest cost of living index.
